
GEOG 6161 Capstone in GIS
Emergency Management Assistance and Evolution of Property Valuations in Cottonwood Heights
Project Overview
This capstone project addressed two distinct needs for the City of Cottonwood Heights: streamlining emergency management data processing and providing interactive visualization of property value changes over time. The project was completed in partnership with the City of Cottonwood Heights and involved the development of a Python script to automate emergency response workflows and the creation of an interactive dashboard to visualize property valuation trends.
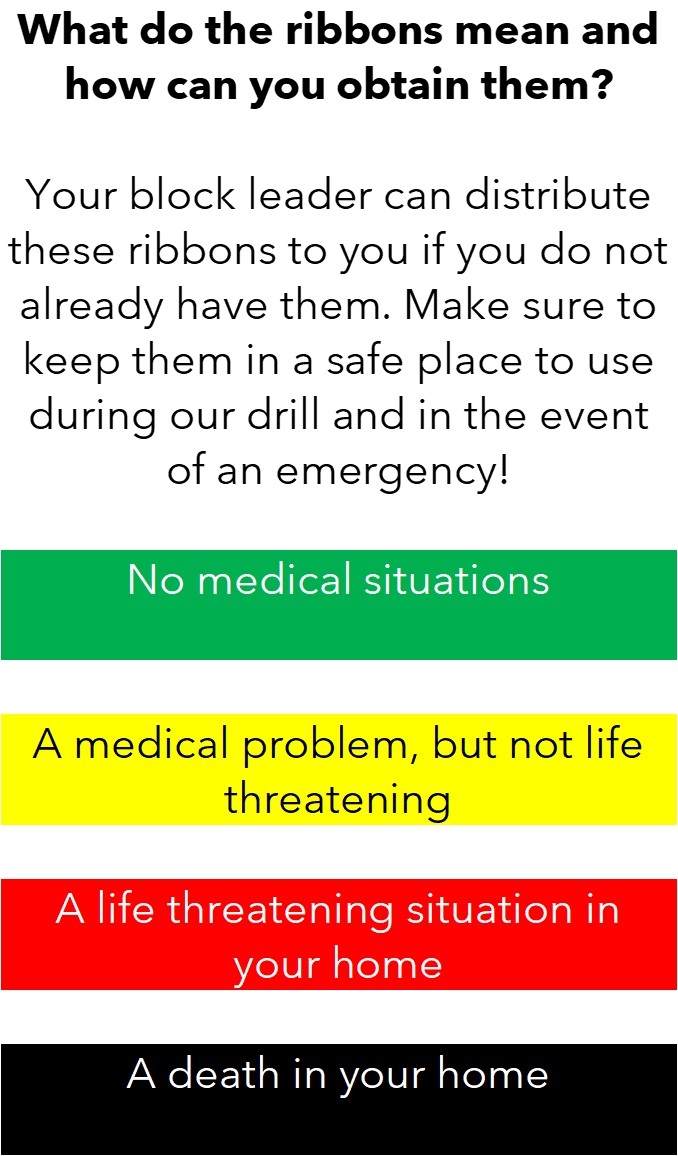
Figure 1: Flag colors are used to indicate household statuses in an emergency.
Part 1: Emergency Management Assistance
Background & Introduction
The City of Cottonwood Heights maintains an emergency preparedness strategy that relies on block, precinct, and district leaders reporting household statuses during emergencies. These statuses are represented by colored flags on residents' doors (Figure 1), indicating whether assistance is needed. The city's emergency preparedness team has partnered with the Cottonwood Heights Amateur Radio Club (CHARC) to streamline information transmission into Excel comma-separated value (CSV) files.
Prior to this project, a largely manual process was used to transfer this information from CSV files into ArcGIS Pro. The first objective was to develop a user-friendly Python script that would allow the Emergency Operations Center (EOC) and CHARC members to upload CSV files and automatically publish the most recent emergency status information, eliminating manual steps in the workflow.
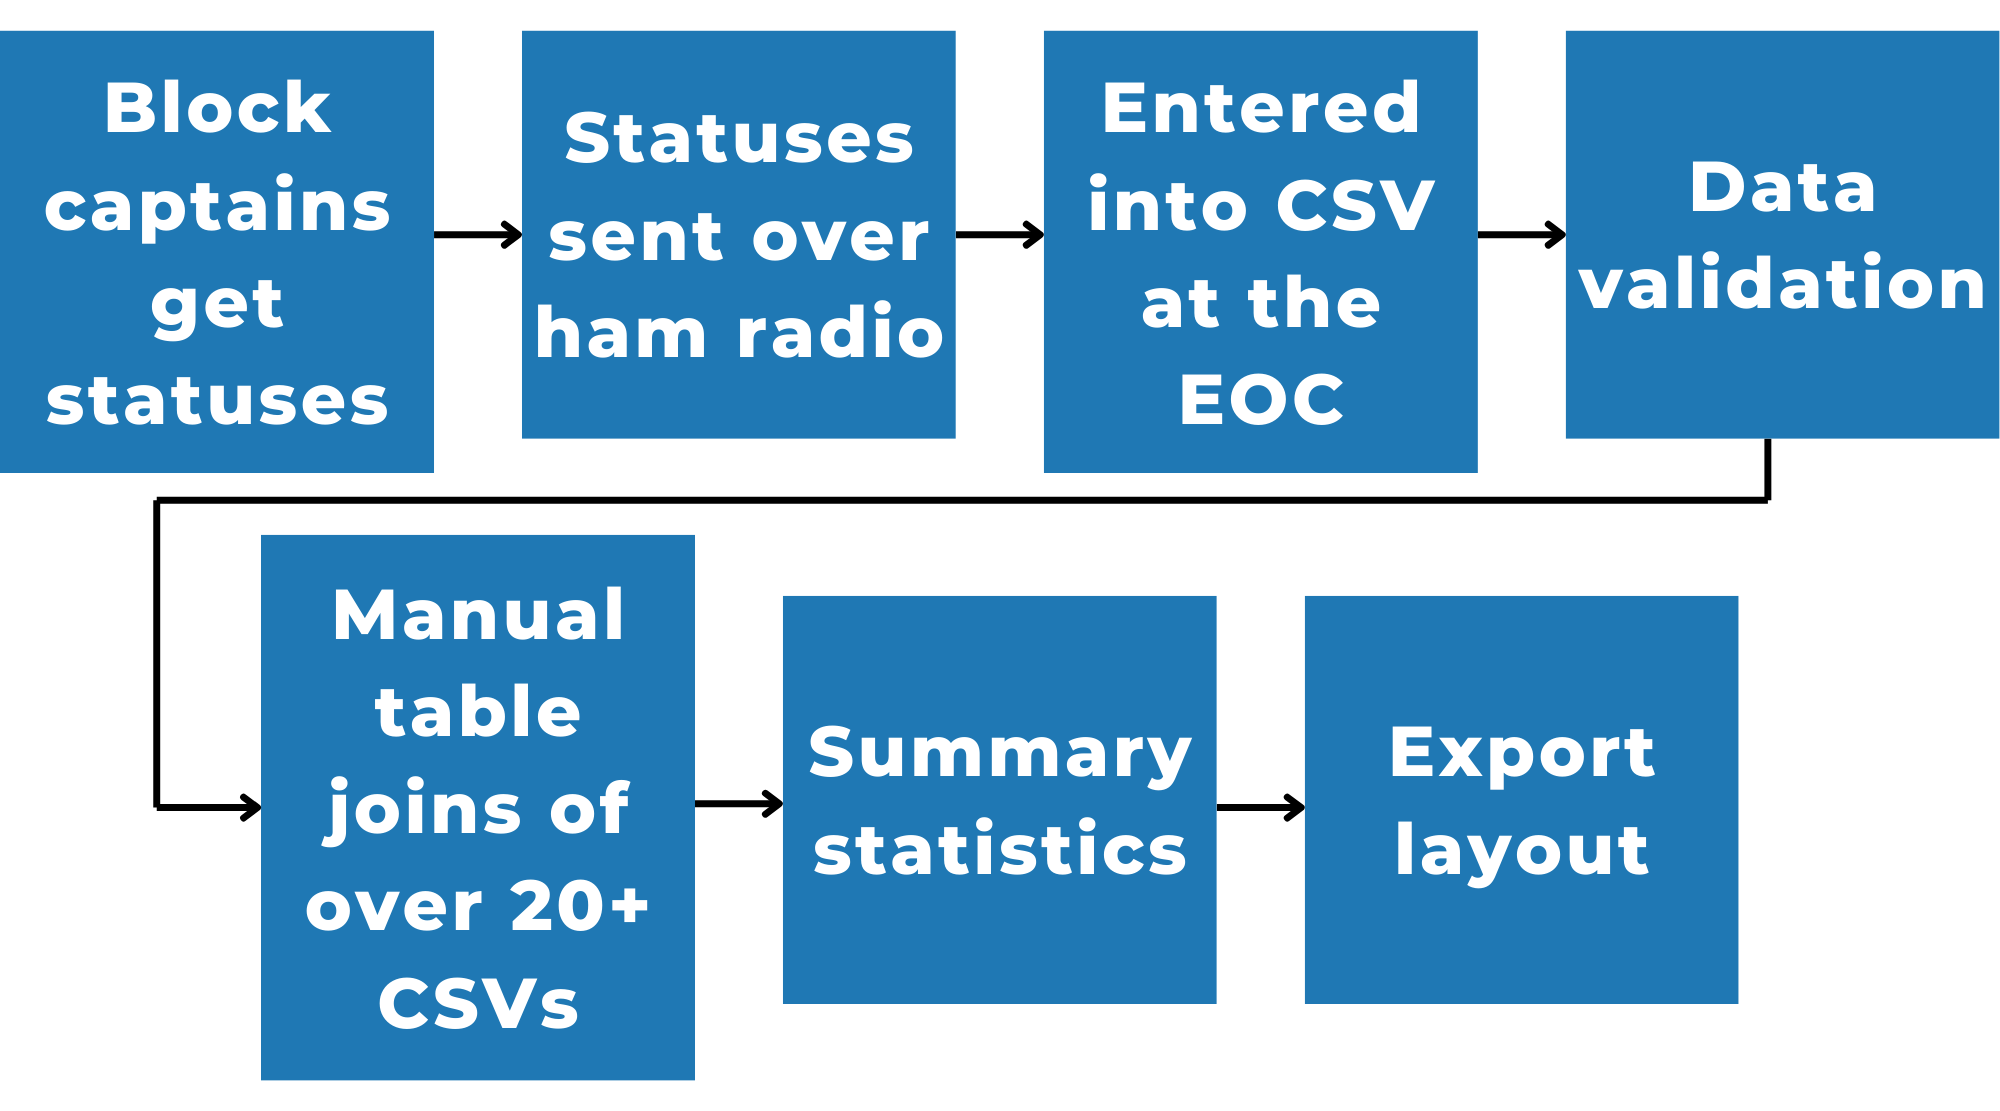
Figure 2: The previous emergency response GIS workflow at Cottonwood Heights.
Methodology
The first task was to document the City's current emergency management procedure. The workflow started with block captains collecting household statuses through visual observation, then transmitting this information to the City's EOC via ham radio. At the EOC, the information was entered into CSV files organized by precinct, with each row representing an address with a unique ID. These CSV files were then manually joined to a feature class in ArcGIS Pro using this ID, and a static map was exported (Figure 2).
After understanding the workflow, pseudocode (visualized in Figure 3) was written to guide the development of the Python script. Visual Studio Code (VS Code) was used to write, test, and debug the code, with additional testing conducted inside ArcGIS Pro using the script as a notebook.
The script includes the following key functions:
- normalize_columns(): Standardizes CSV column names to account for variations in naming conventions.
- combine_csvs(): Merges multiple CSV reports into a single Pandas DataFrame while tracking the source file for each record.
- update_feature_class_from_csv(): Updates the GIS feature class with the latest status information using AddressID as the primary key.
- create_summary_table_from_feature_class(): Creates a pivoted summary table showing status counts by district with standardized categories.
- export_layout_to_jpeg(): Exports the ArcGIS Pro layout as a timestamped JPEG file for record-keeping.
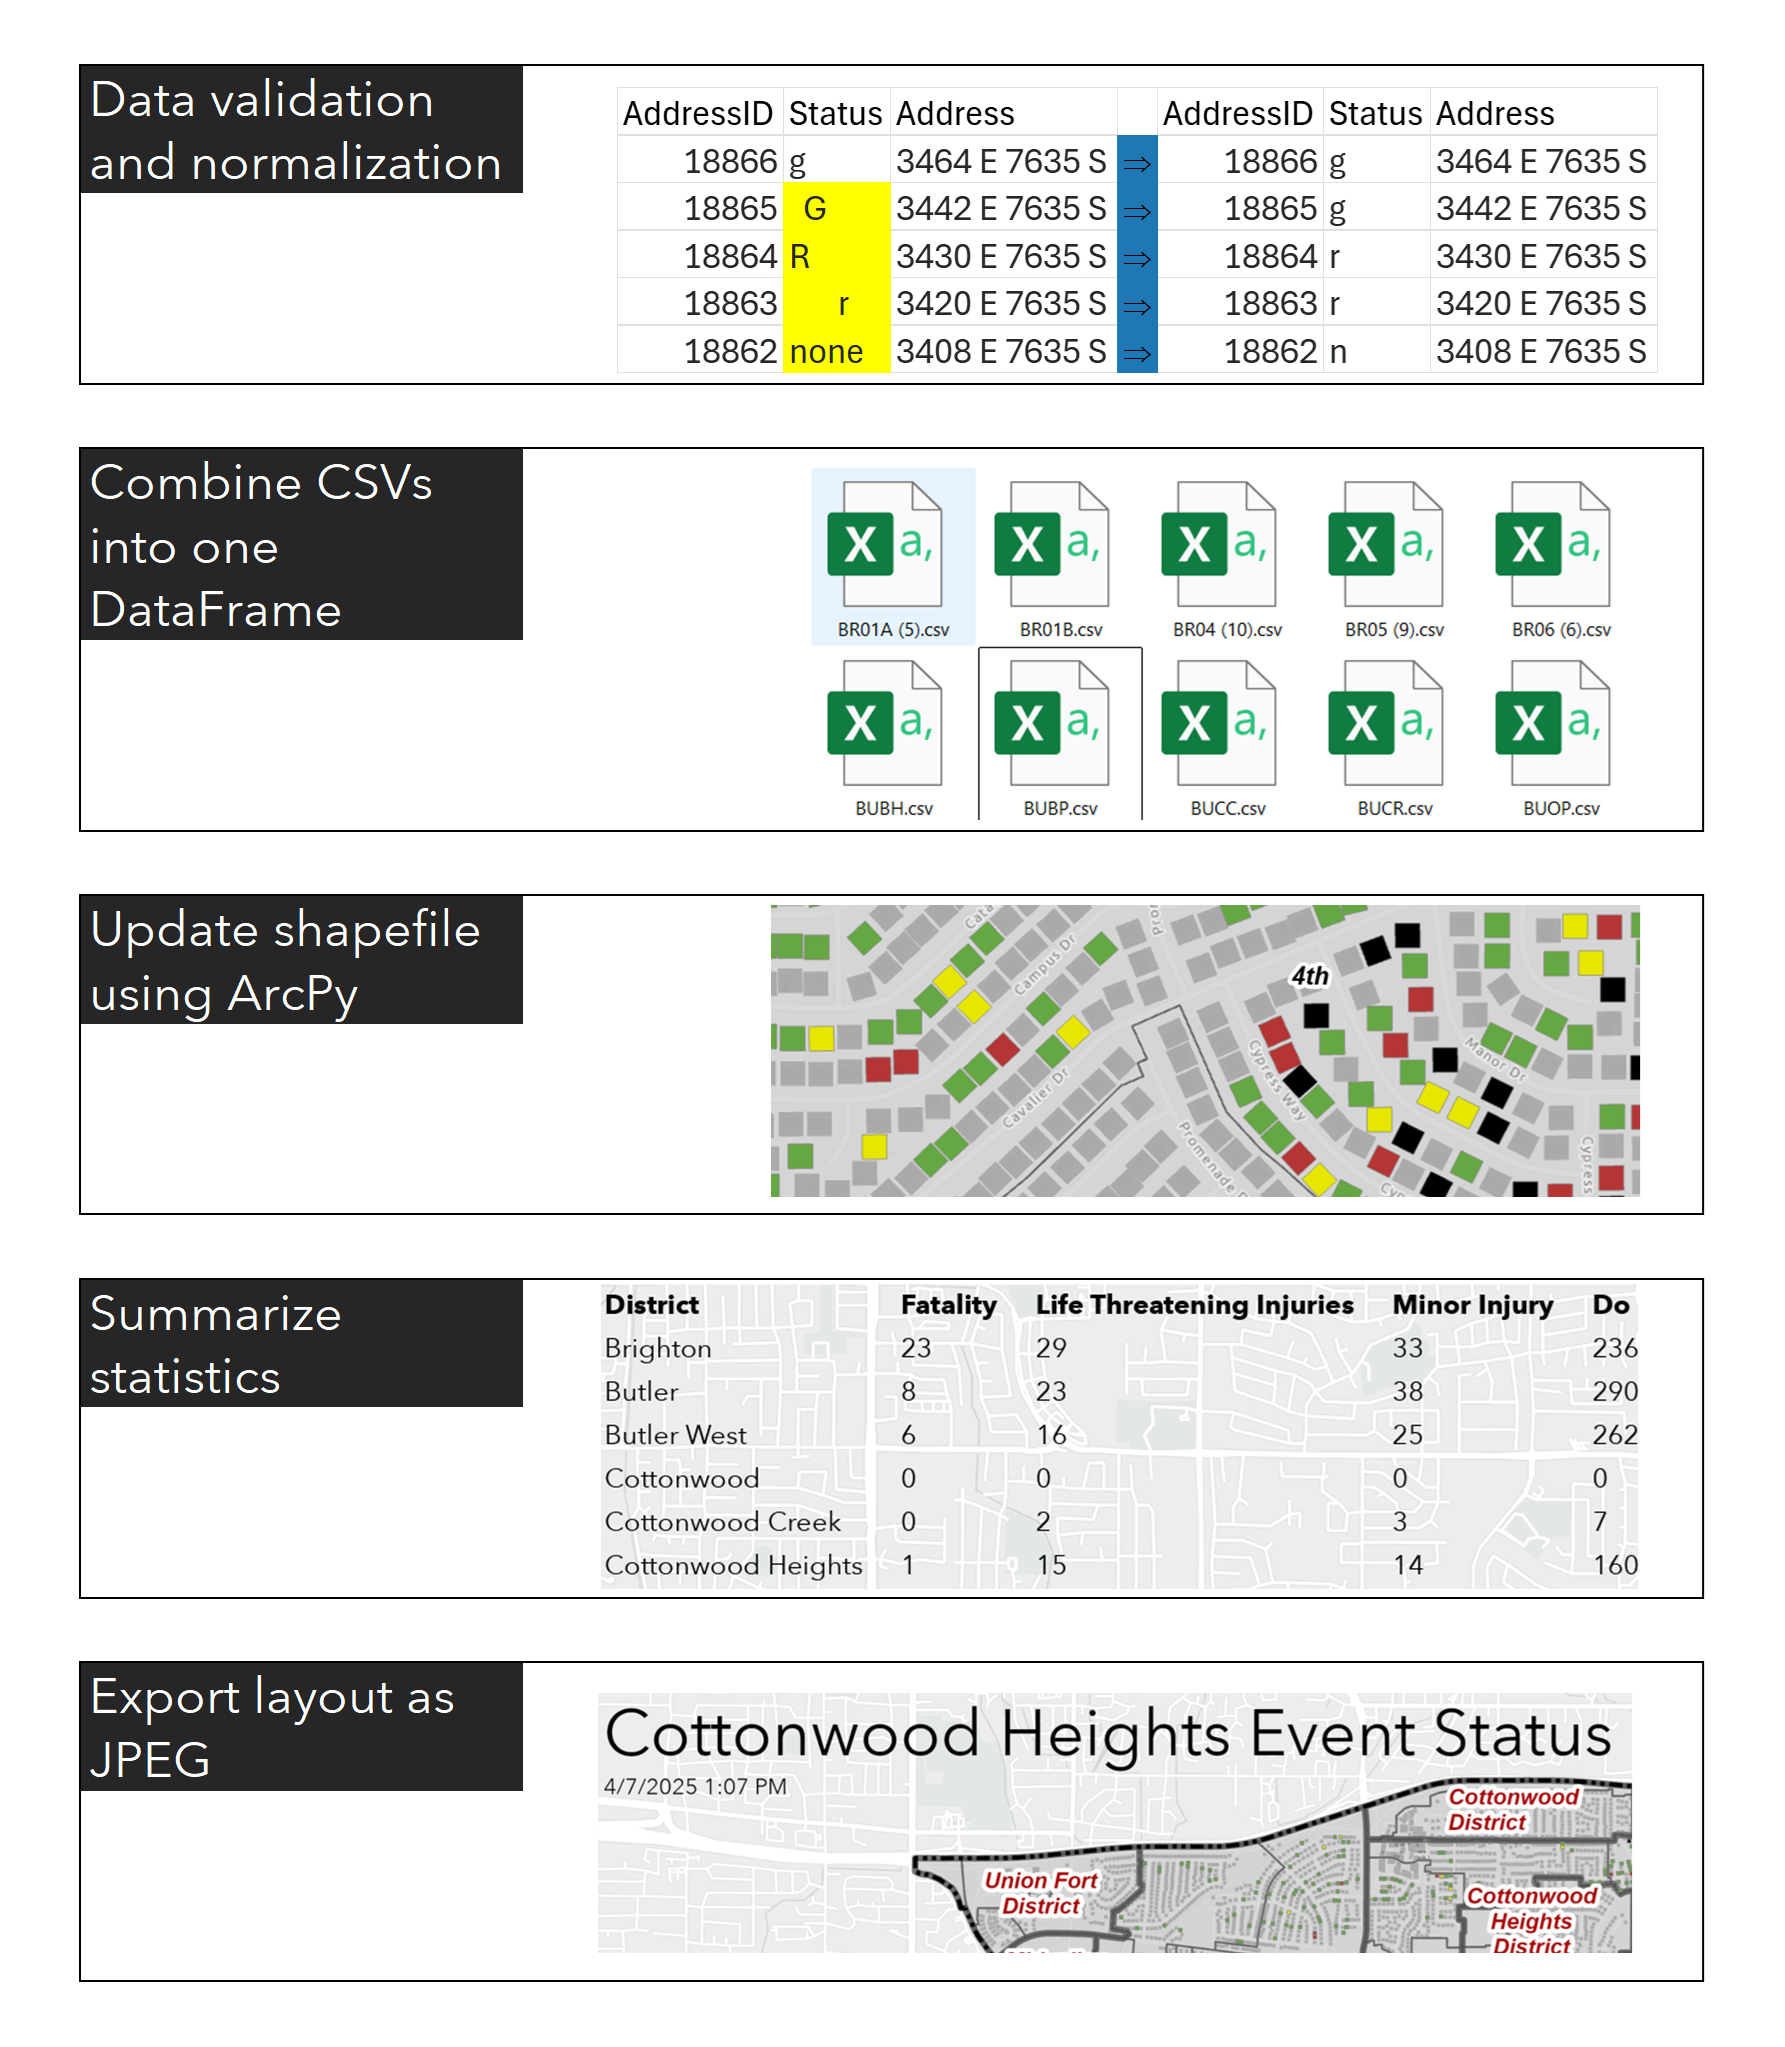
Figure 3: Visualized pseudocode showing the process of the Python script. Each box represents a coded function, with an image relating to manual work that the script replaces.
Results
The key result of this part of the project was a fully functional Python script that automates several steps from the previous emergency management GIS workflow (Figure 4). The script successfully processes multiple CSV files while normalizing data formats and combining them into a single DataFrame. The ArcGIS Pro feature class is updated, summary statistics are conducted, and a layout is automatically exported (Figures 5, 6) with a timestamp, allowing for temporal analysis.

Figure 4: The emergency management GIS workflow after implementation of the Python script.
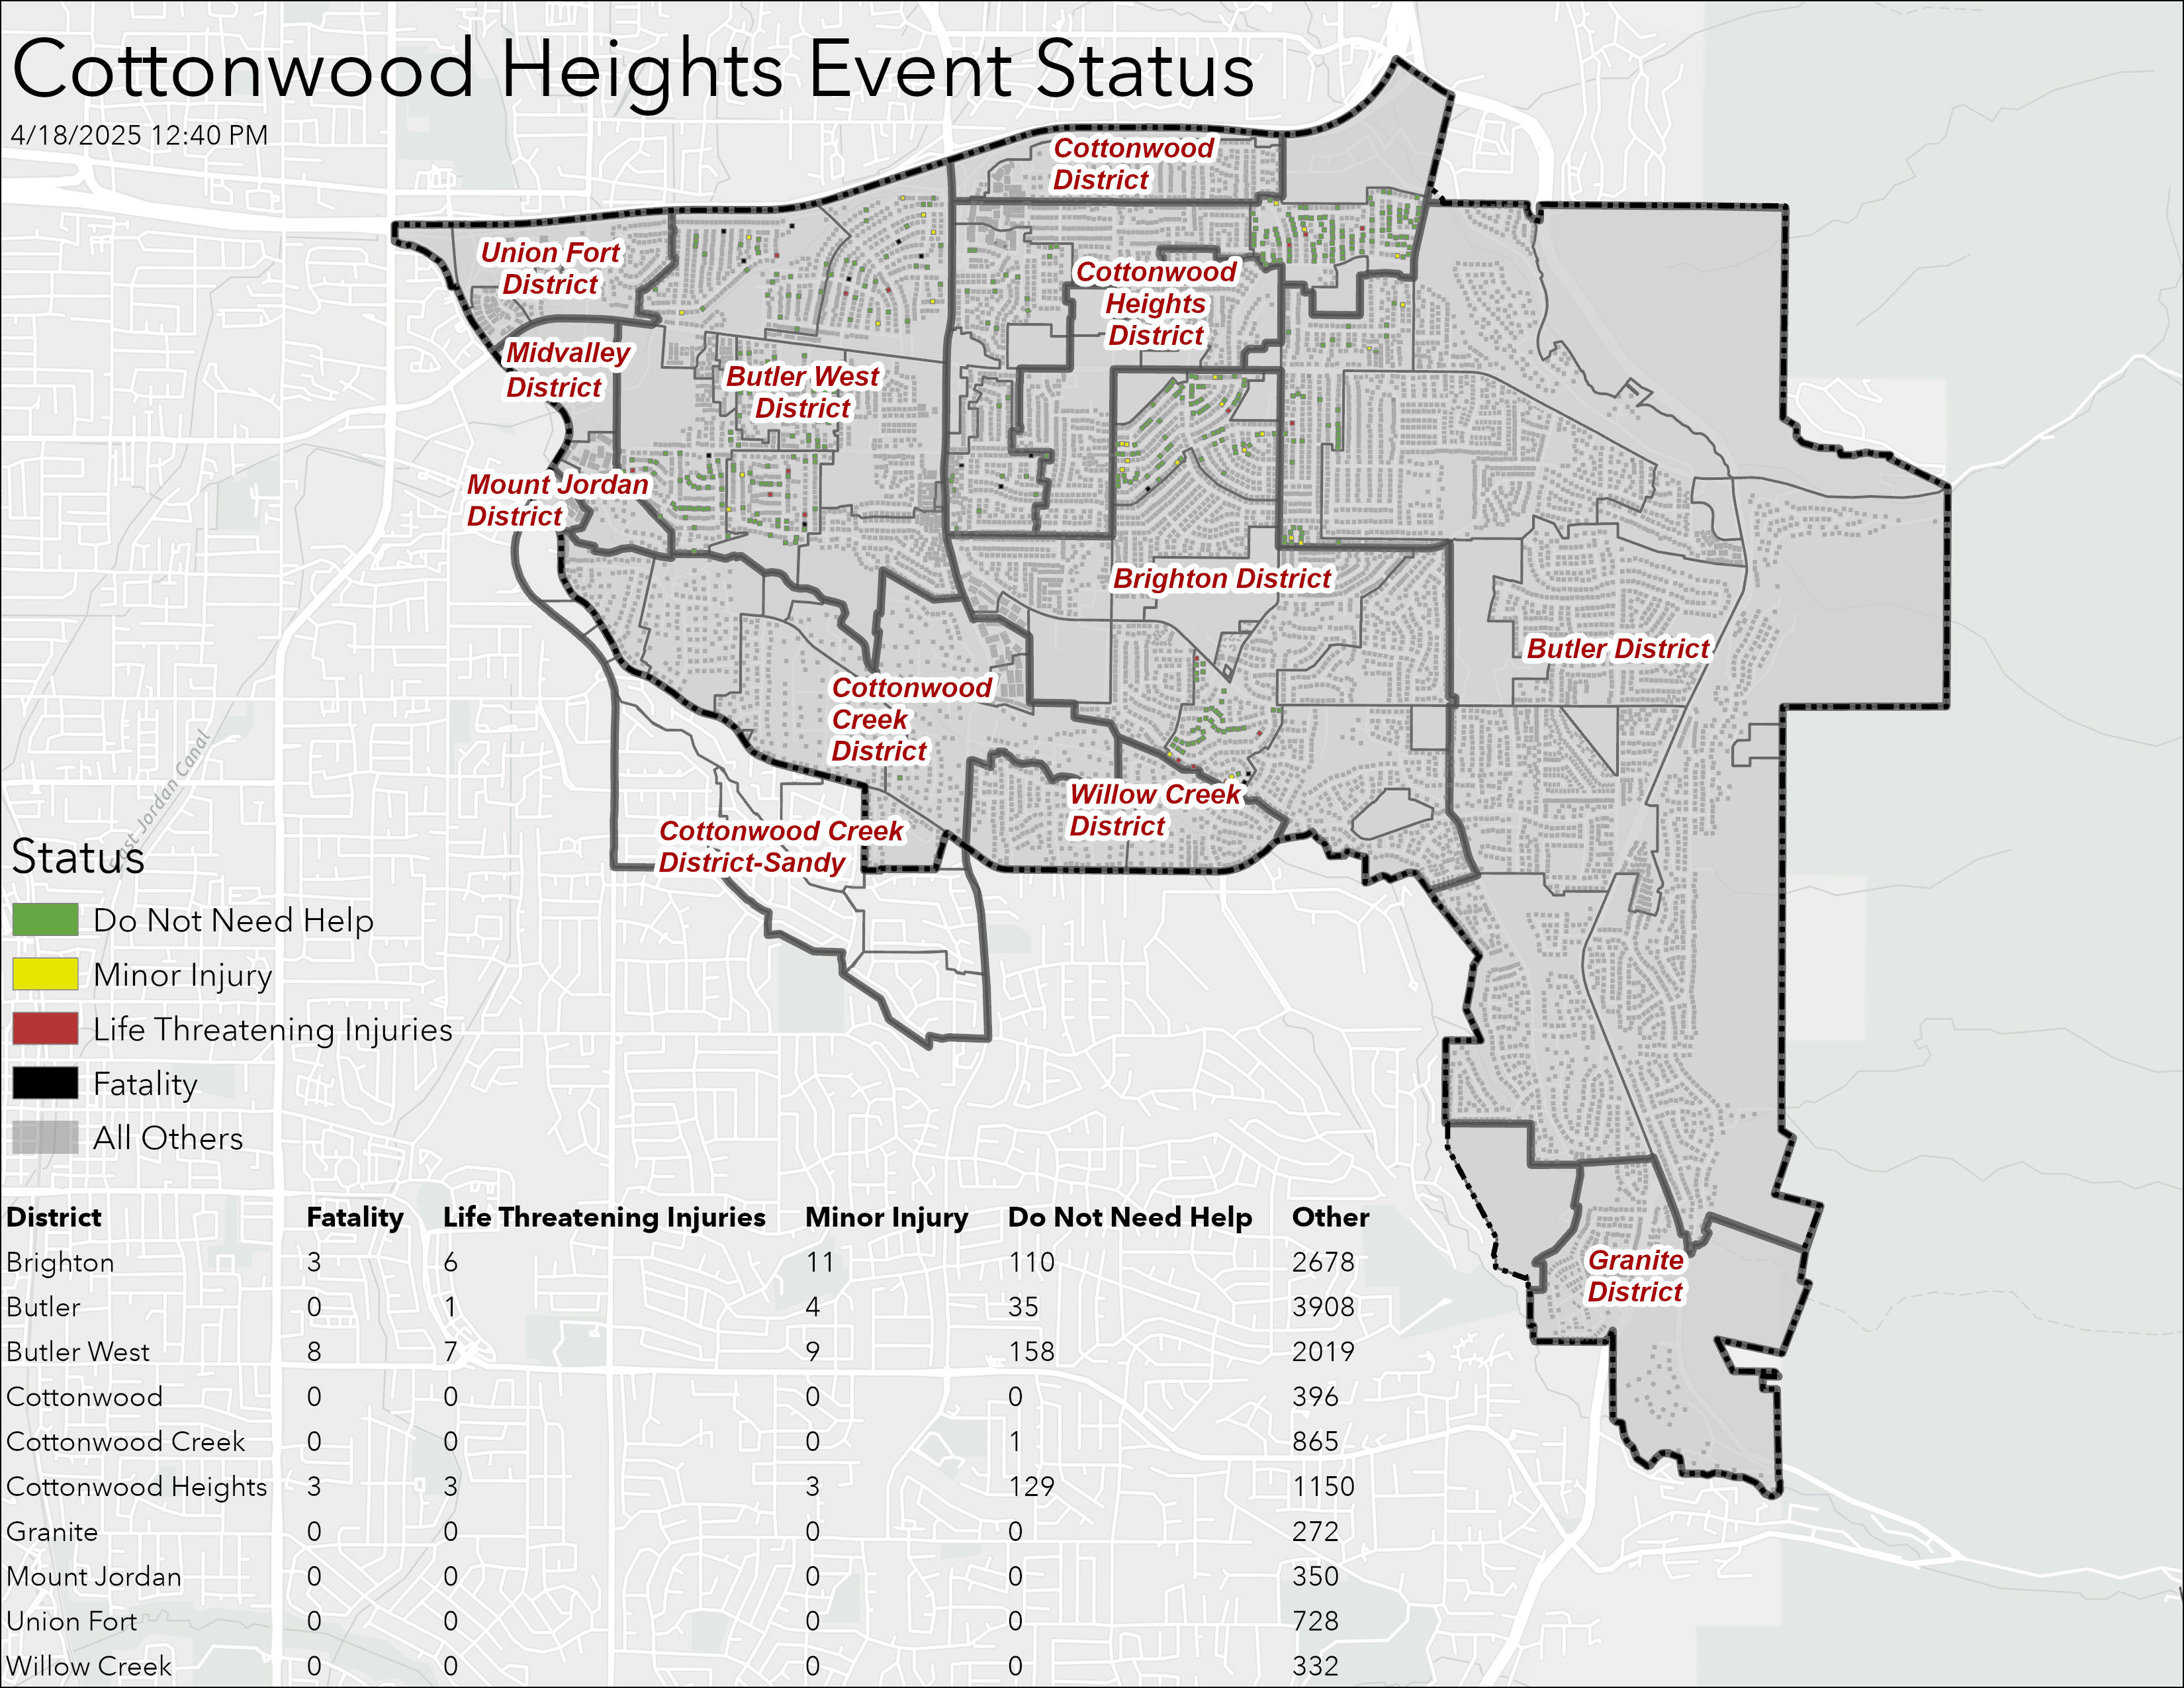
Figure 5: A city-wide layout using test data from the 2025 Shakeout exercise.
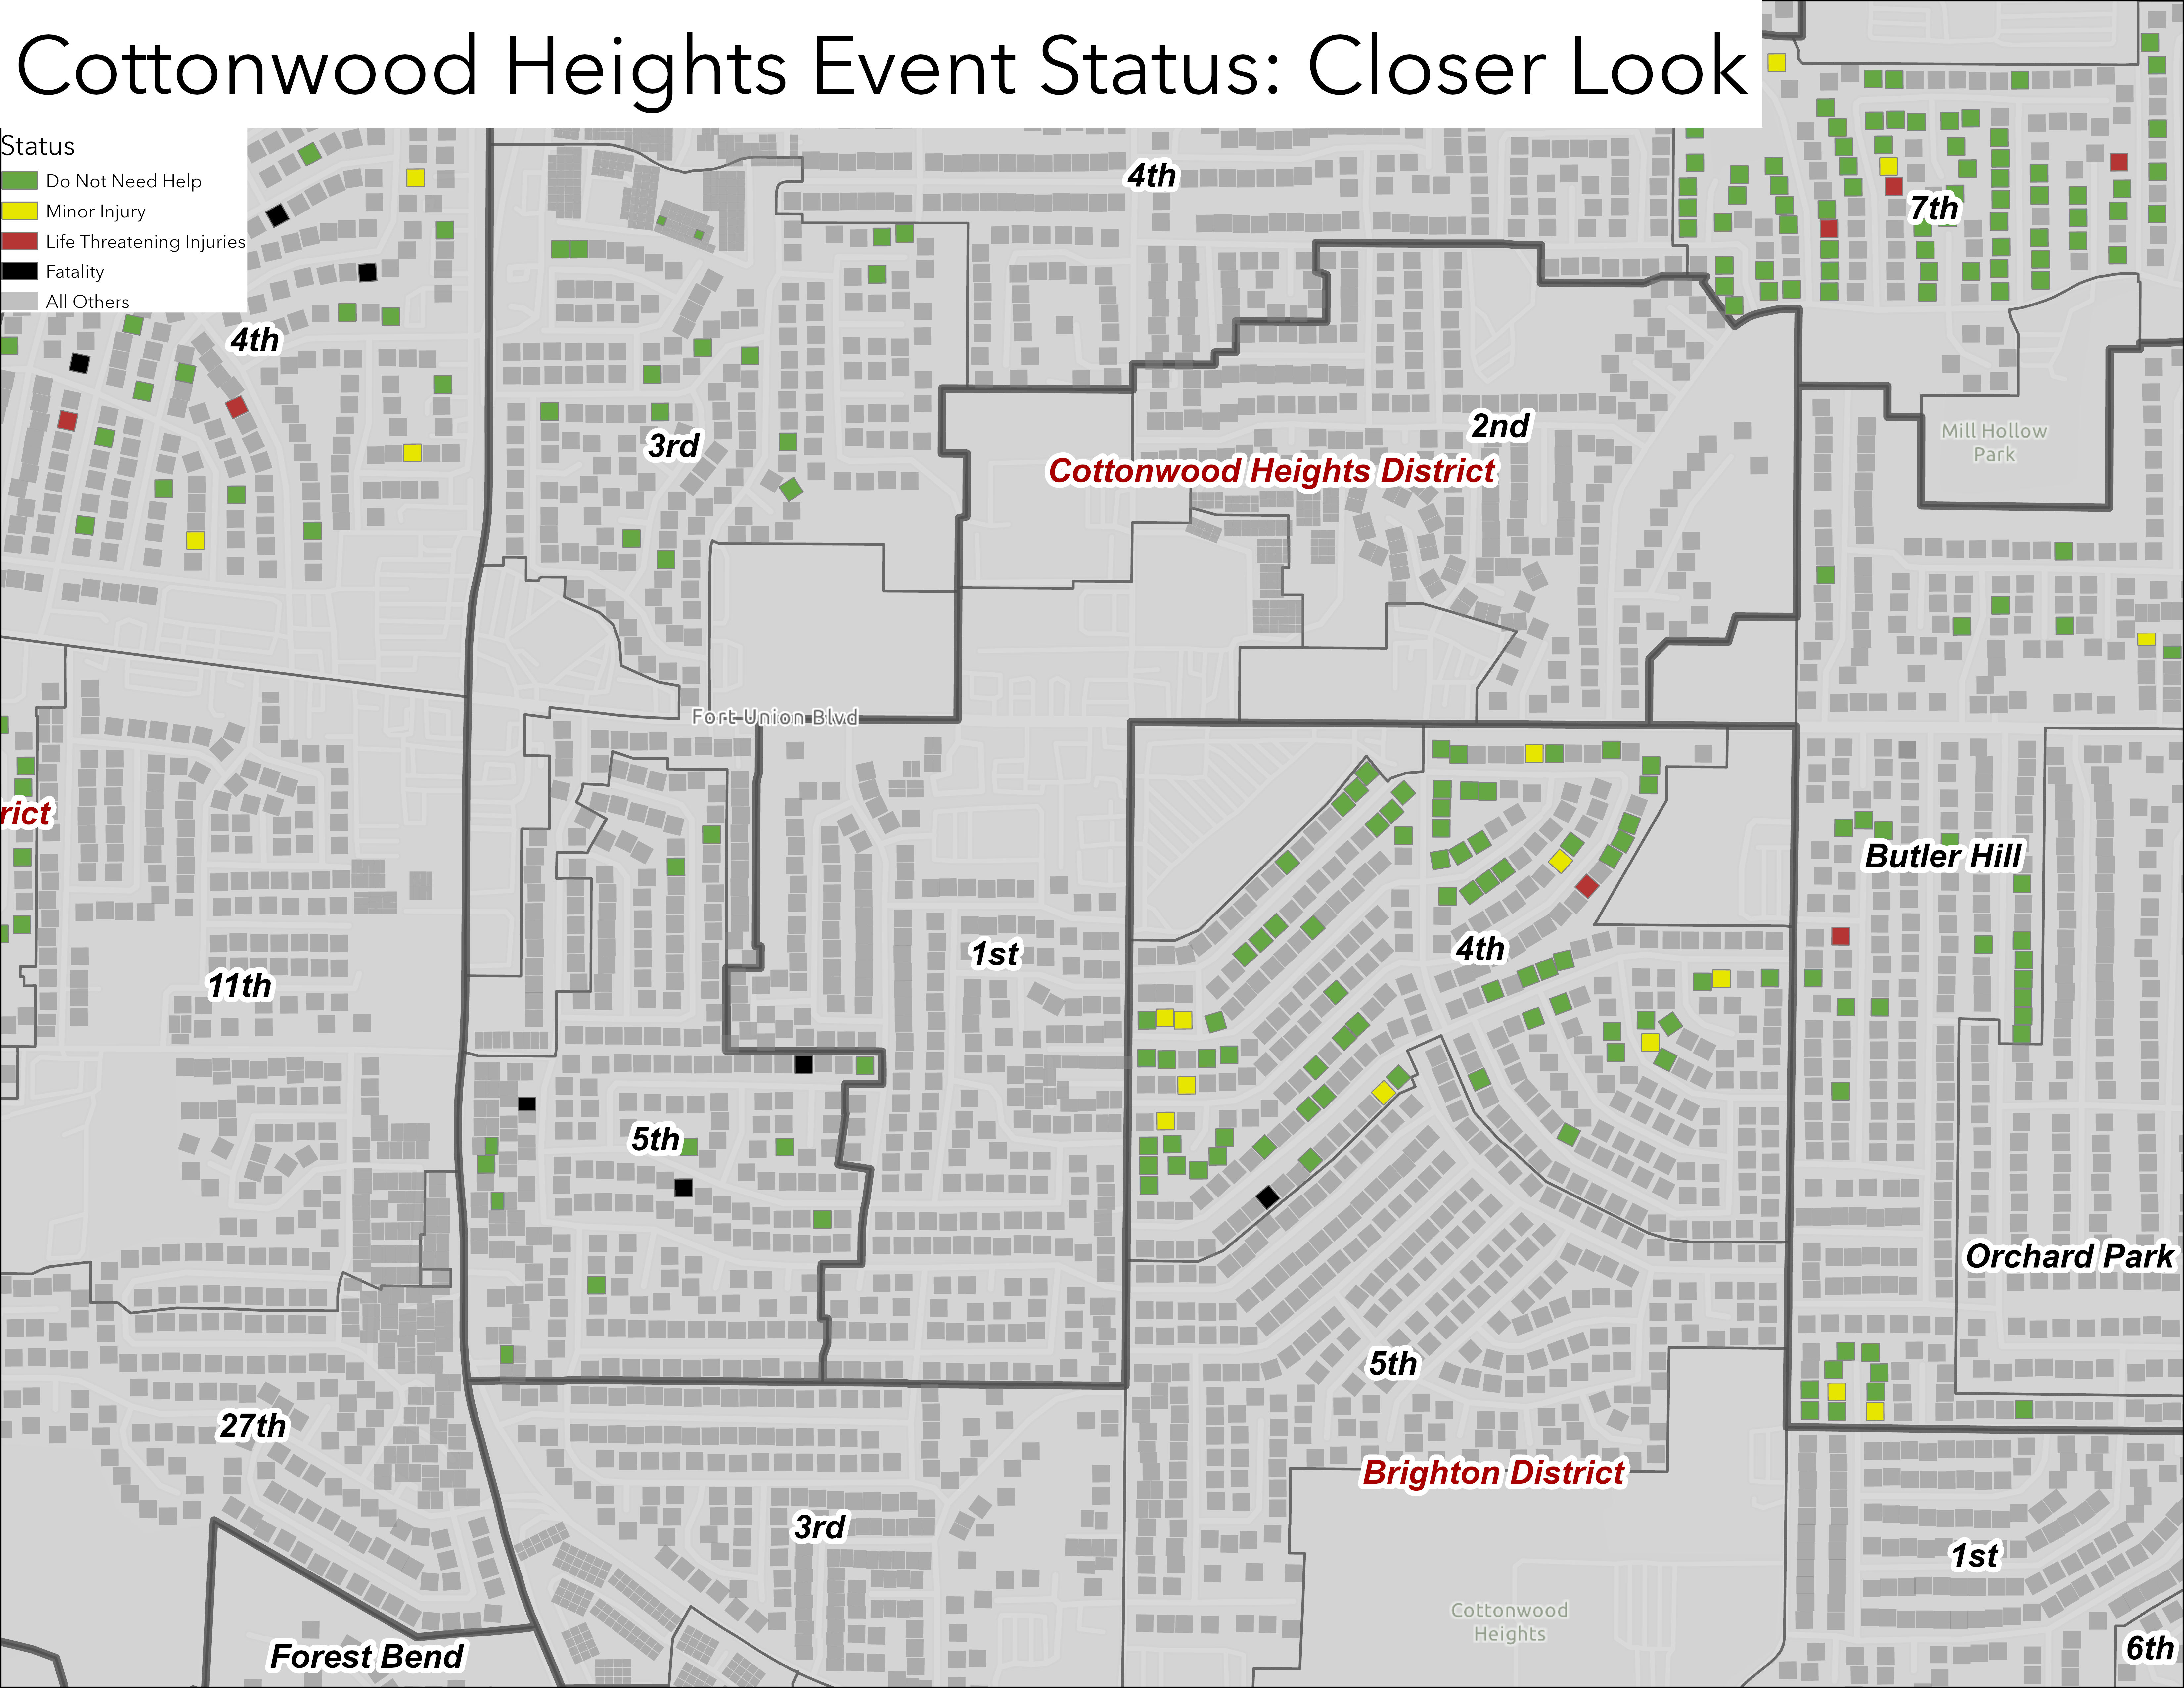
Figure 6: A zoomed in layout using test data from the 2025 Shakeout exercise.
Discussion
The Python script significantly improved the efficiency of emergency response by eliminating manual data processing steps. What previously required multiple manual operations now functions as a streamlined process with minimal user intervention. A key feature of the script is its data validation and normalization capabilities, handling variations in data formatting that frequently occur when multiple users are submitting reports.
For example, the script normalizes status codes ('G', 'g', 'green') to a standardized format, making the system more resilient and accommodating of real-world conditions. This flexibility is essential in emergency situations where data consistency cannot always be guaranteed.
Part 2: Evolution of Property Valuations
Background & Introduction
The second objective focused on property valuations within Cottonwood Heights, with particular emphasis on the area surrounding the former Hillside Plaza, where "The Heights," the City's upcoming town center, will be constructed (Figure 7). City planners required an interactive visualization tool to understand how property values have changed over time to support their decision-making processes.

Figure 7: A conceptual rendering of The Heights (source: Cottonwood Heights).
Methodology
Data were received in the form of Salt Lake County parcel feature classes, one for each tax year. The Salt Lake County Assessor's Office provided information covering over two decades, but the data were only complete for 2017 onwards, so the timeframe was limited accordingly. A field was added to each feature class to calculate changes in total adjusted value from the year prior, as well as from 2017. The data were then symbolized in ArcGIS Pro according to percent value changes and exported to ArcGIS Online (AGOL).
Using AGOL's Dashboard product (Figure 8), an interactive tool was created for visualization. Individual dashboards were created for each year of data, then stacked on top of each other as embedded content in a "master dashboard."
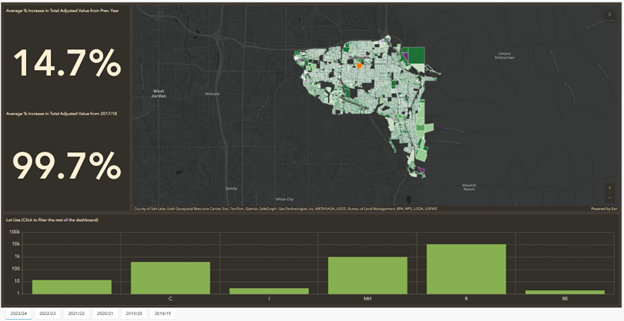
Figure 8: The property valuation dashboard created in ArcGIS Online.
Results & Discussion
The property valuation component resulted in an interactive AGOL dashboard that visualizes property value changes since 2017. Data are symbolized by the percentage change in adjusted value since 2017 and can be filtered based on lot use, allowing residential properties to be examined separately from commercial.
The dashboard serves as a valuable tool for city planners, enabling them to identify areas of significant value change and understand the potential impact of the new town center development. The interactive nature of the visualization allows for deeper exploration of the data than would be possible with static reports.
One limitation is the availability of historical data, which only extends back to the 2017/2018 tax year with adjusted values. Future iterations could incorporate older data sets if they become available.
Conclusion
This project successfully addressed two distinct needs for the City of Cottonwood Heights. The new Python script allows for the automation of steps that were previously time-consuming, enhancing decision-making capabilities during critical situations. The property valuation dashboard provides city planners with insights into how property values have evolved, helping to inform planning decisions related to the new town center development.
Through these two components, the project demonstrates the value of GIS in municipal governments, showing how it can drive more powerful decision-making in emergency management and city planning contexts.
Skills Used
- Python Programming (ArcPy, Pandas)
- GIS Analysis and Visualization
- ArcGIS Pro and ArcGIS Online
- Dashboard Design and Development
- Spatial Data Processing
- Process Automation
- Property Valuation Analysis
- Emergency Management Workflows
Acknowledgements
This project was completed in partnership with the City of Cottonwood Heights. Special thanks to Melissa Blue for providing guidance, data, and support. Additionally, Dr. Phoebe McNeally and the University of Utah are owed appreciation for their instruction and resources.